Personal tools
You are here: Home Beamlines CLAESS Beamline commissioning

Beamline commissioning

[most recent entry is topmost]

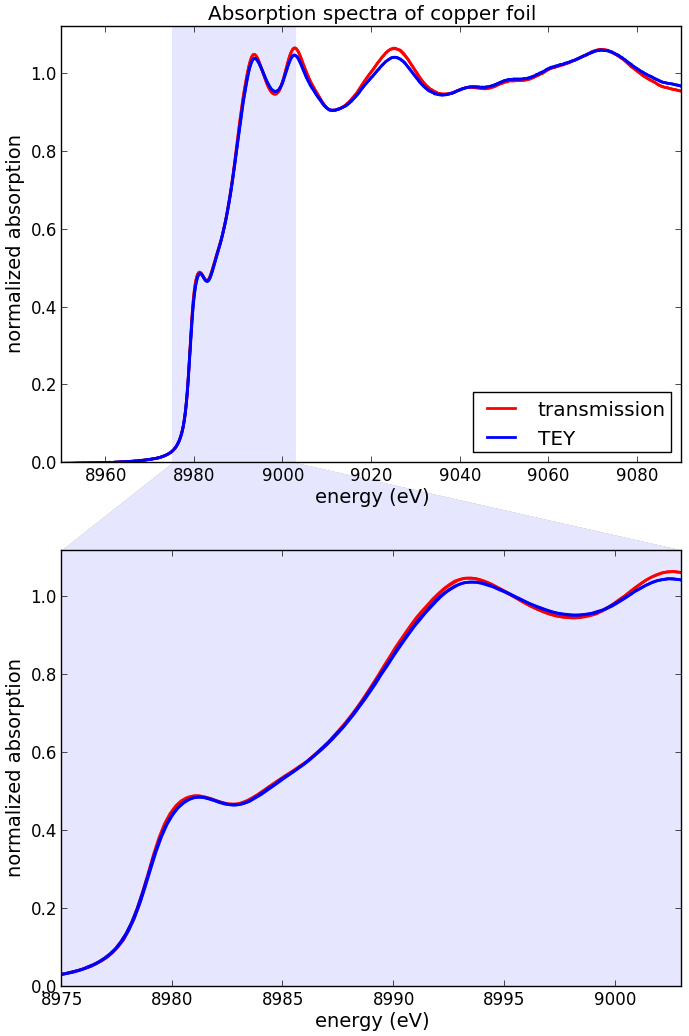
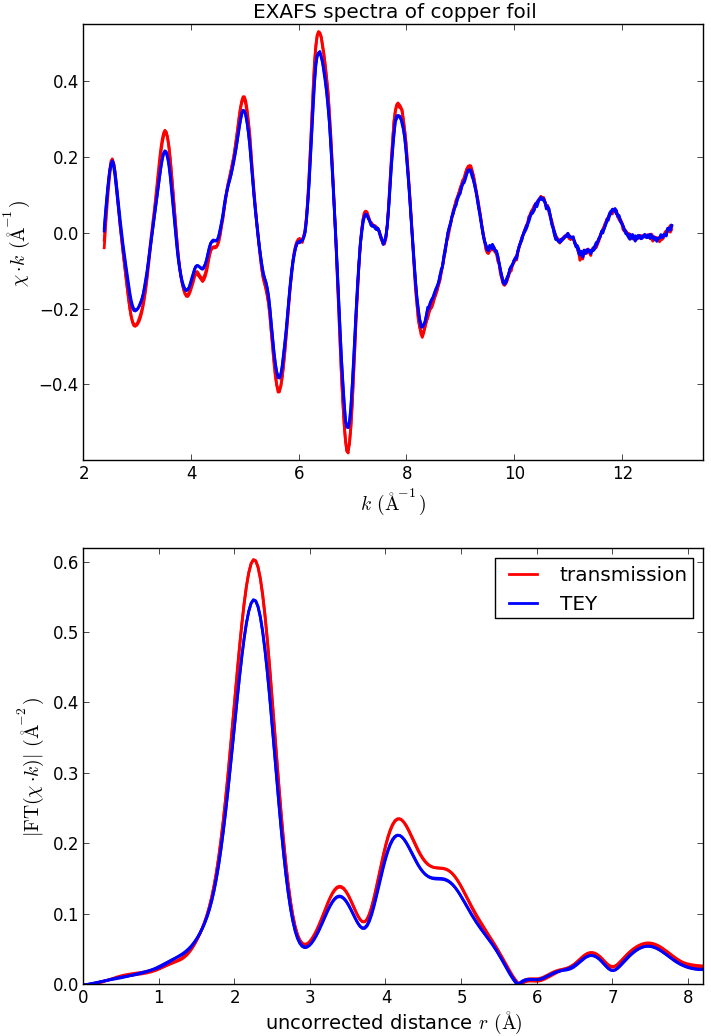
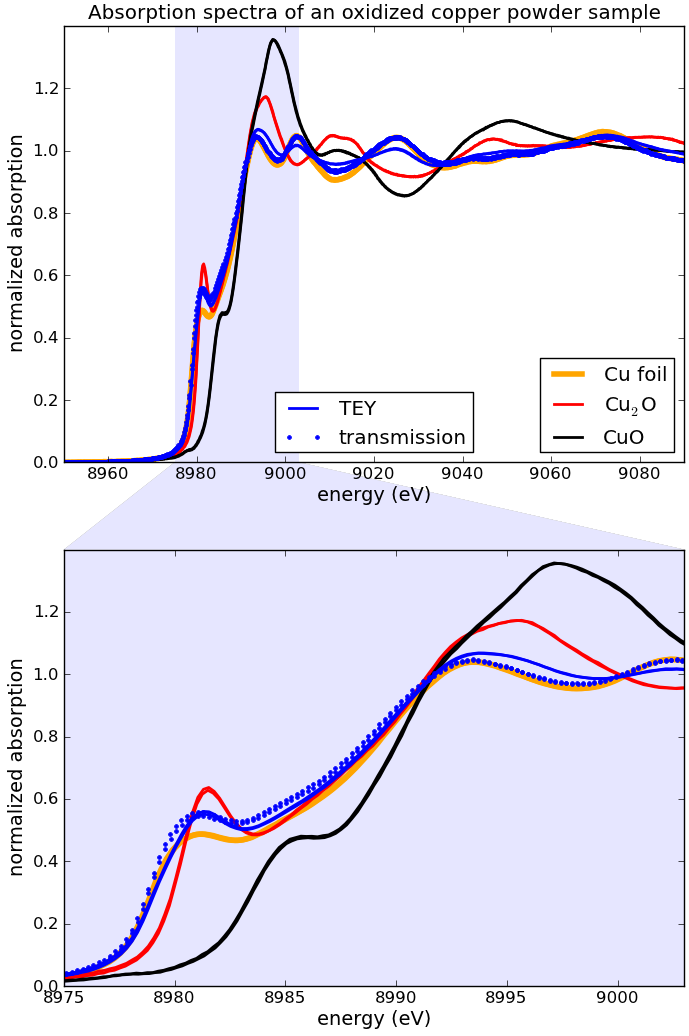
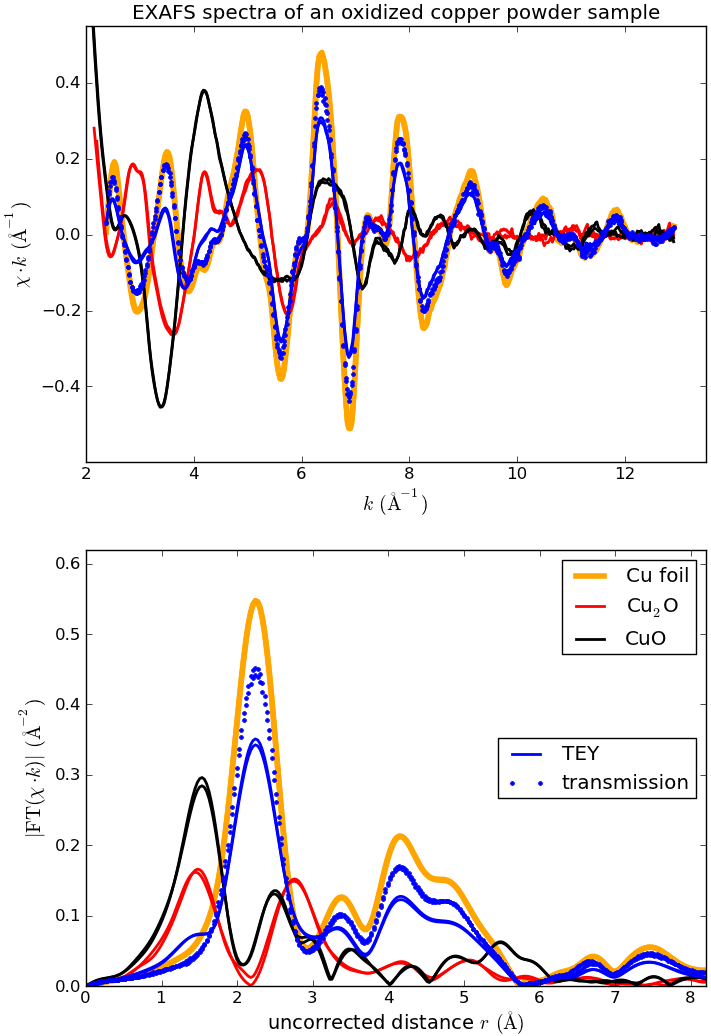
13.02.2013 Total Electron Yield detection

A third way of measuring absorption spectra, along with transmission and fluorescence detection, has been recently introduced at CLÆSS – the Total Electron Yield (TEY) detection. This technique is extremely surface sensitive. For example, the TEY copper foil spectra (see below) are lower in amplitude and result in the coordination number (CN) in the 1st shell of equal to ~10. Because the terminating layer has CN=6 and the next ones have 12, and because of the attenuation factor of electrons exp(-2d/λ), the apparent CN given by TEY is less than 12. For CN=10 a trivial estimation gives λ~10 Å, which is in line with X-Ray Data Booklet, Section 3.2.
 
The figure below (XANES and EXAFS of copper foil in simultaneous TEY and transmission) has two repeats for each spectrum, 4 curves in total per plot. The spectra were measured in continuous mode at ~9 min per full EXAFS spectrum.

TEY Cu foil XAFS, mu TEY Cu foil XAFS, chi and FT

The TEY detection can be useful for studying surface structure as opposed to bulk structure given by transmission measurements. The figures below exemplify a study of oxidation dynamics by simultaneous measurements of transmission and TEY, performed in collaboration with Henkel Adhesive Technologies. Both TEY XANES and TEY EXAFS exhibit partial oxidation at the surface copper atoms: the edge is shifted towards higher energies and EXAFS FT acquires a signal at ~1.4 Å (phase uncorrected). This oxidation is not ‘seen’ by the transmission spectra. The three references here were also measured in TEY. Each spectrum has two repeats at different sample positions.

TEY oxidized Cu powder XAFS, mu TEY oxidized Cu powder XAFS, chi and FT

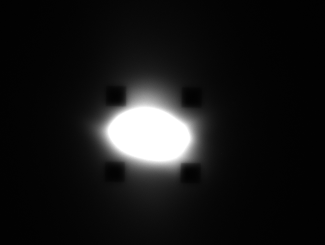
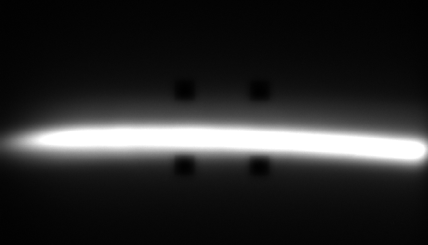
05.12.2012 Beam focusing and defocusing

The beam can easily be focused or defocused. It is widely believed that a bigger beam spot should result in higher quality spectra due to effective averaging over a bigger sample area. Although such an improved was not observed, defocusing may be desired in the case of samples prone to photo-induced reduction. The photon flux density can be reduced by an order of magnitude, like in the figures below (the inner distance between the four squares is 300 µm), or even more depending on the sample size.

focused beam at the sample position vertically focused beam at the sample position defocused beam at the sample position

05.12.2012 Moderately quick energy scanning

In contrast to the previous quick scanning, the new procedure performs constant querying of the energy position and therefore is suitable for repetitive scans, also in both directions. The figure below shows a comparison with old step scans. The small differences can be attributed to different focalizations: this time the beam was defocused up to ~1x1mm2 (for working with biological samples prone to photoreduction, see below), whereas the step scans were taken with a  ~300x200µmspot.

Comparison of QXAFS with step scans, mu Comparison of QXAFS with step scans, chi and FT

The continuous way of scanning has two advantages: (i) it removes a rather high per-point overhead in step scans and (ii) gives access to sample dynamics of minute time scale; in particular, it may be helpful for detecting and solving problems with x-ray induced reduction. The figure below shows XANES spectra of a copper containing peptide which demonstrate x-ray induced reduction from Cu(II) towards Cu(I). The quick scanning allows one to select a few first spectra referring to the pristine structure.

Comparison of QXAFS with step scans, mu

30.10.2012 Quick energy scanning

The group of Prof. R. Frahm (O. Müller, O. von Polheim, P. Becker) from University Wuppertal, Germany, together with the beamline team have measured the first quick absorption spectra. The spectra were measured using the ionization chambers and the electronics of the visitors. The figure below shows the raw spectra of copper foil taken within 0.5 seconds (XANES within 25 ms!), see the upper x-axes.

QXAFS of copper foil, raw data

Compared to the conventional step scans, the spectra are noisier with some amplitude distortions. Better linearity, time response and noise of the upcoming versions of the beamline ionization chambers and electrometers should improve the quality of the quick XAFS spectra.

QXAFS of copper foil, mu QXAFS of copper foil, chi and FT

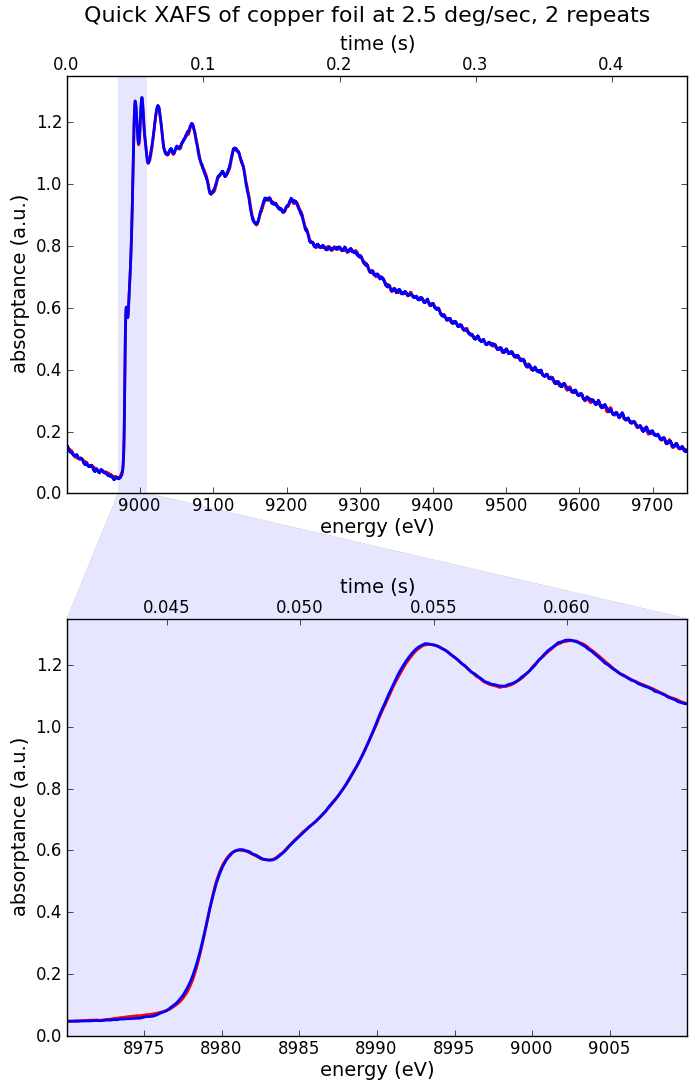
07.10.2012 Real samples (pellets). Monochromator stabilization

The piezo feedback controlling the fine pitch adjustment of the second crystal is now working. It stabilizes intensity and spot position of the beam in the experimental station.

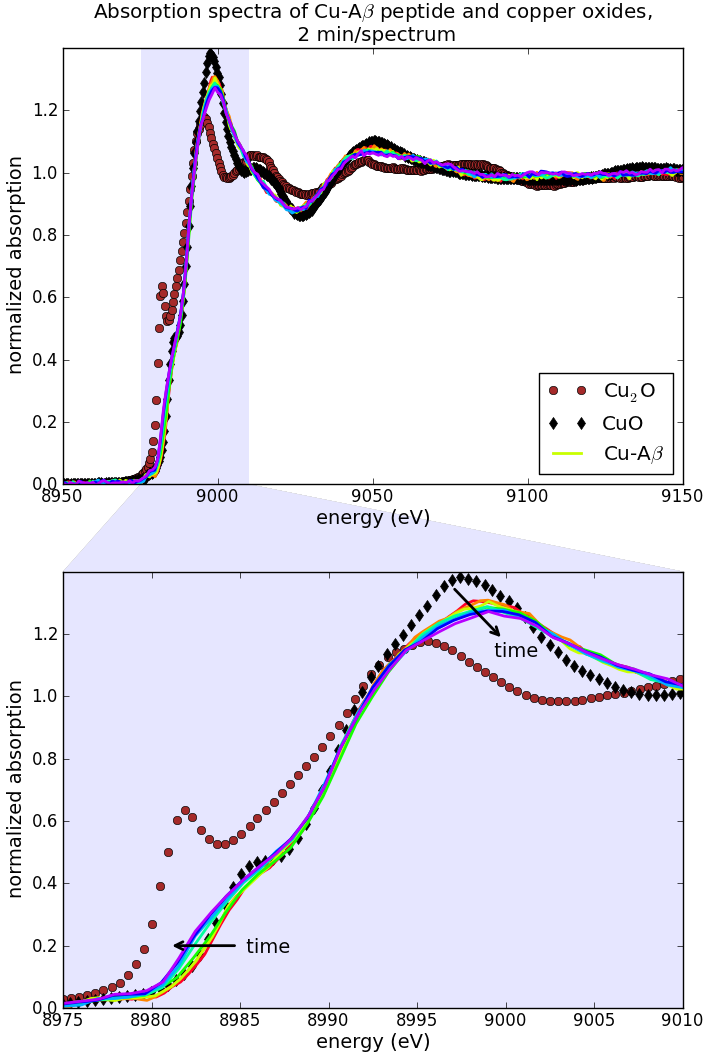
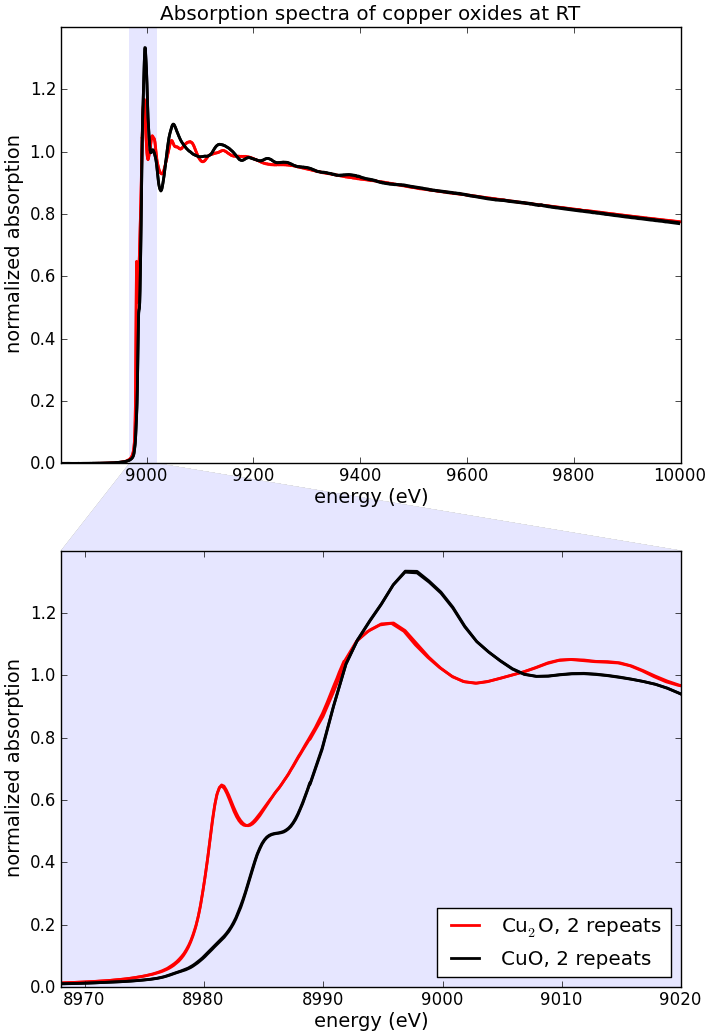
The figures below show spectra of two copper oxides, Cu2O and CuO, prepared as cellulose-supported 5-mm-diameter pressed pellets. The sampling time was 0.1 s and in the EXAFS part was growing as k2. The spectra have good overall reproducibility.

mu EXAFS weighted by k^2


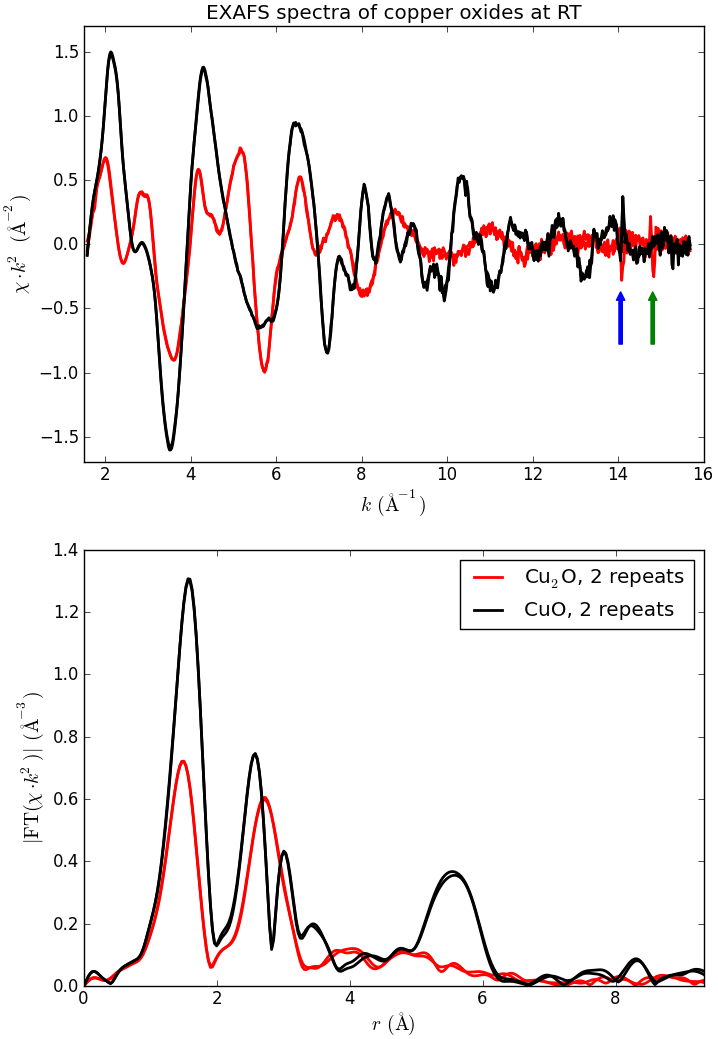
There are two issues to consider:

1) Noise

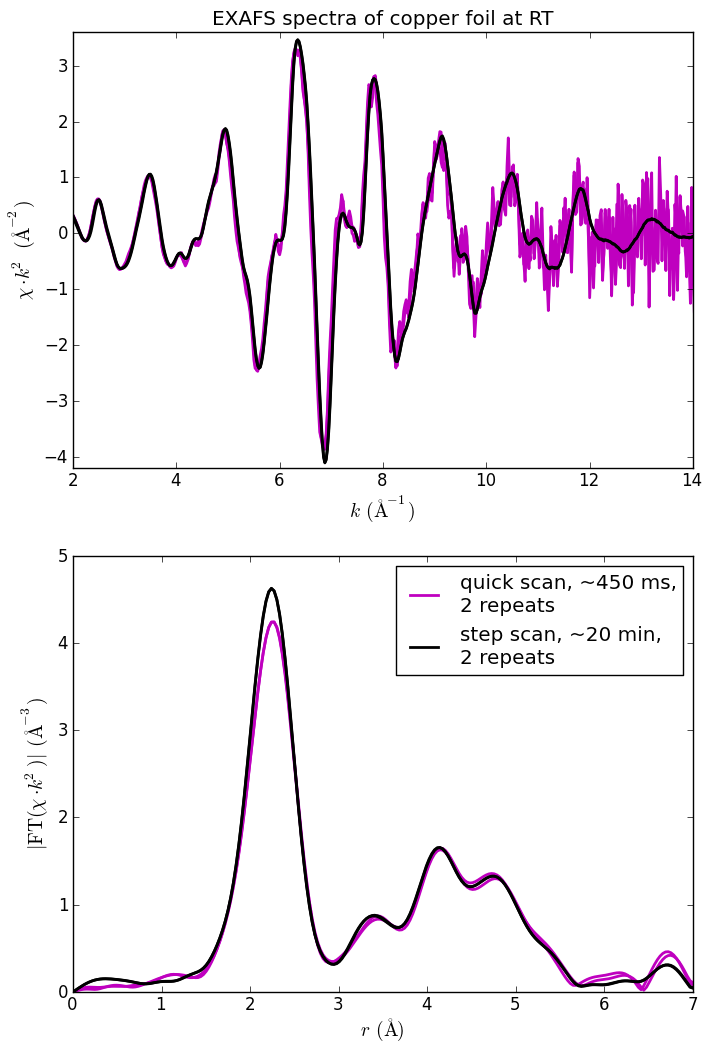
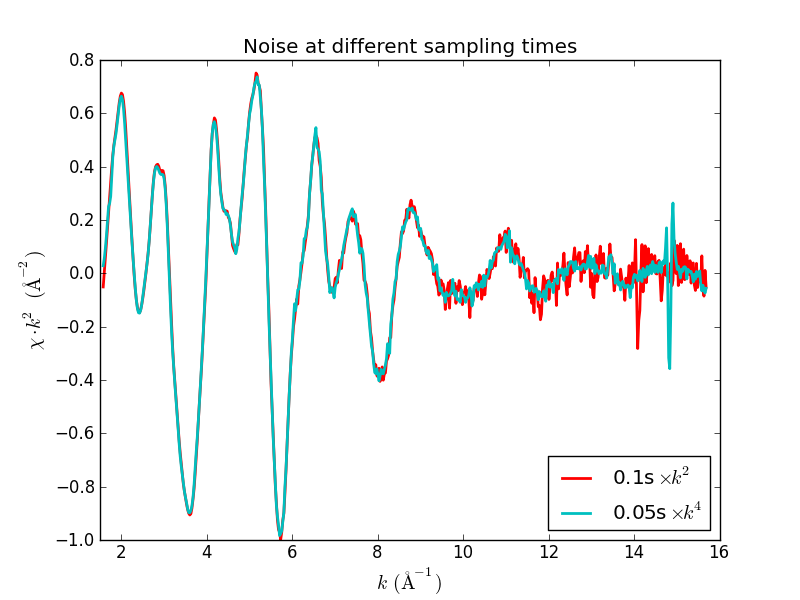
The noise at high k values is normal and can be reduced by longer acquisition times. In the figure below the sampling time was growing as k2 from 0.1 s up to 0.84 s and as k4 from 0.05 s up to 3.55 s.

chi taken at different speed

2) Glitches

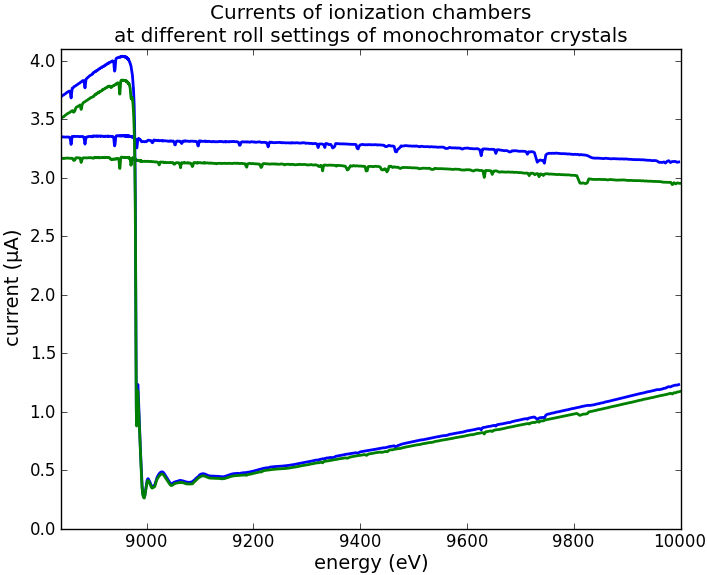
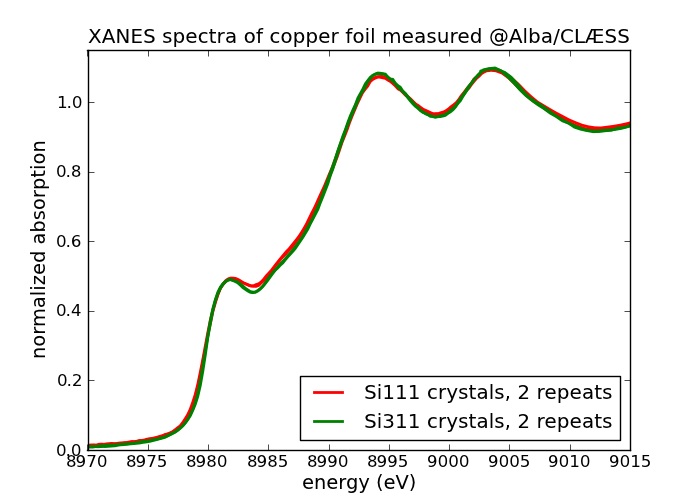
The glitches are intrinsic features of monochromator crystals and cannot be removed. In the figure below one can see how many glitches are present in Cu K-edge EXAFS spectra. Most of them are normalized out after taking the ratio i0/i1; some of them persist after the normalization. On one hand, these glitches are very sharp and contribute to the FT EXAFS at very long distances and therefore can be simply neglected. On the other hand, the glitches can be moved at will by varying the roll angles of both crystals. In the figure below the curves of blue and green colors demonstrate two sets of glitches at various roll angles. These two roll settings give differently positioned unnormalized glitches as shown by the blue and green arrows on the χ·k2 graph above. Having glitches at essentially different energies, two repetitions of the same spectrum can serve as mutual references for the conventional deglitching procedures. It should be noted also that the presence of glitches strongly depends on the sample homogeneity, cf. with the spectra of copper foil below.

currents

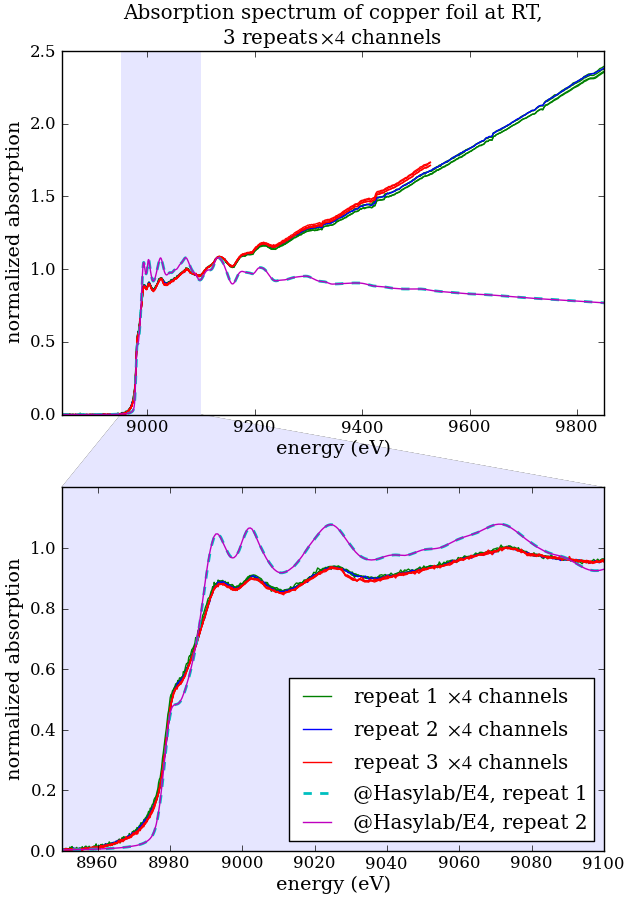
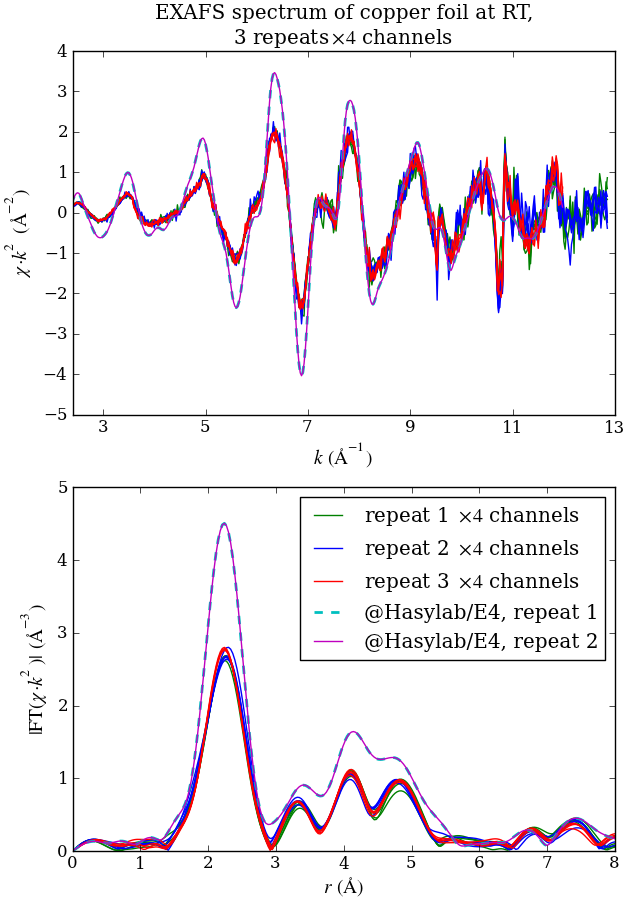
10.05.2012 The first highest quality spectra!

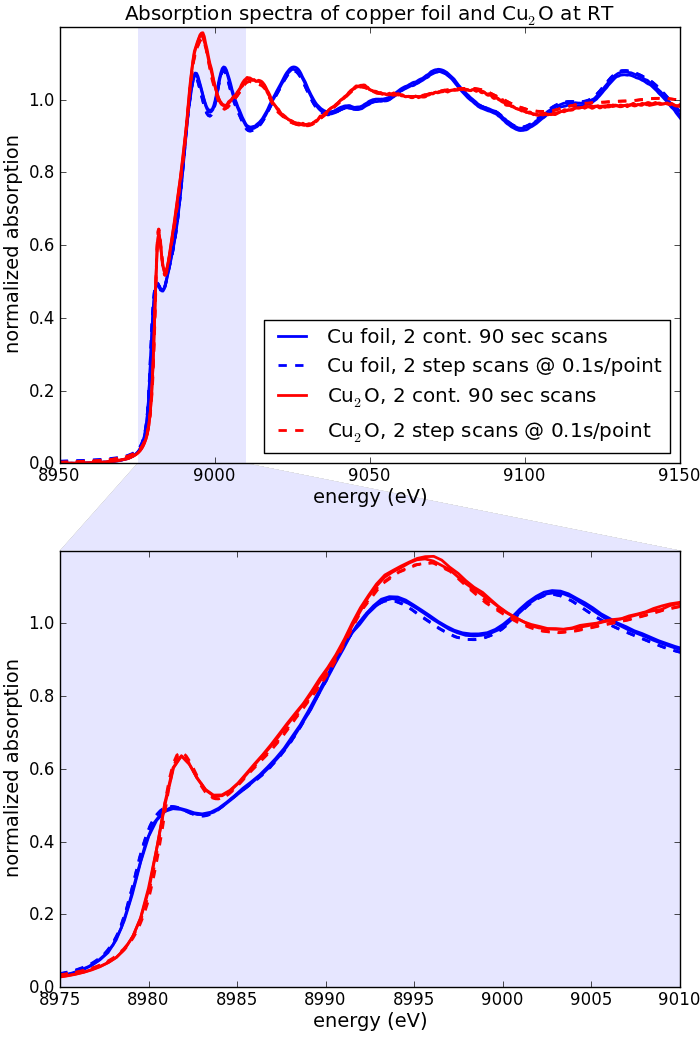
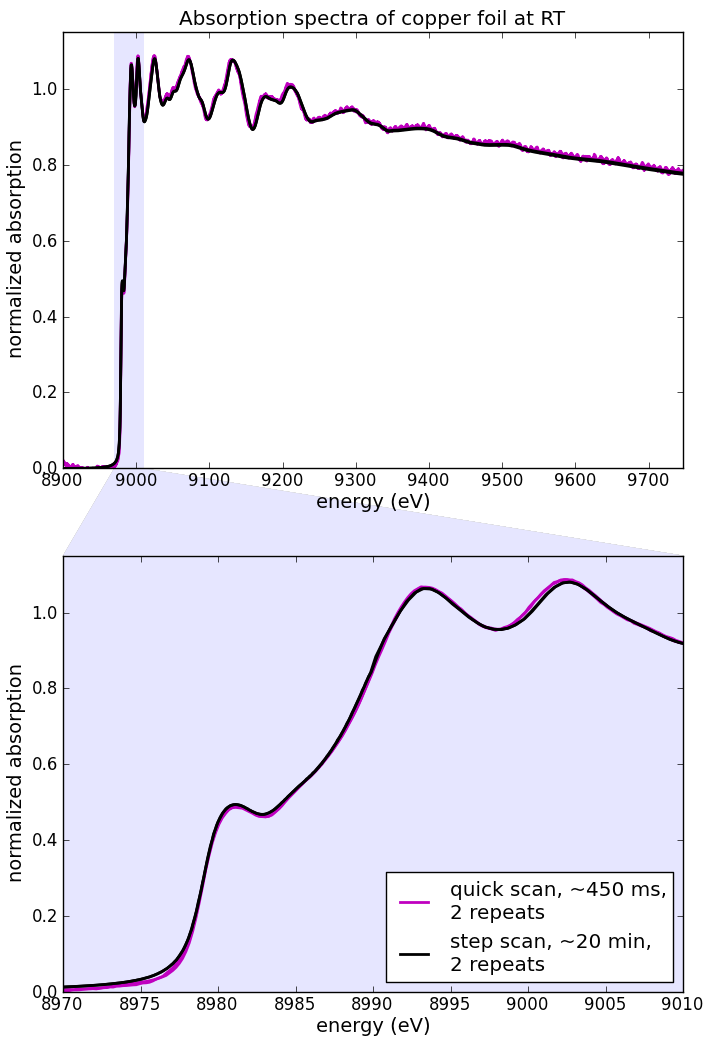
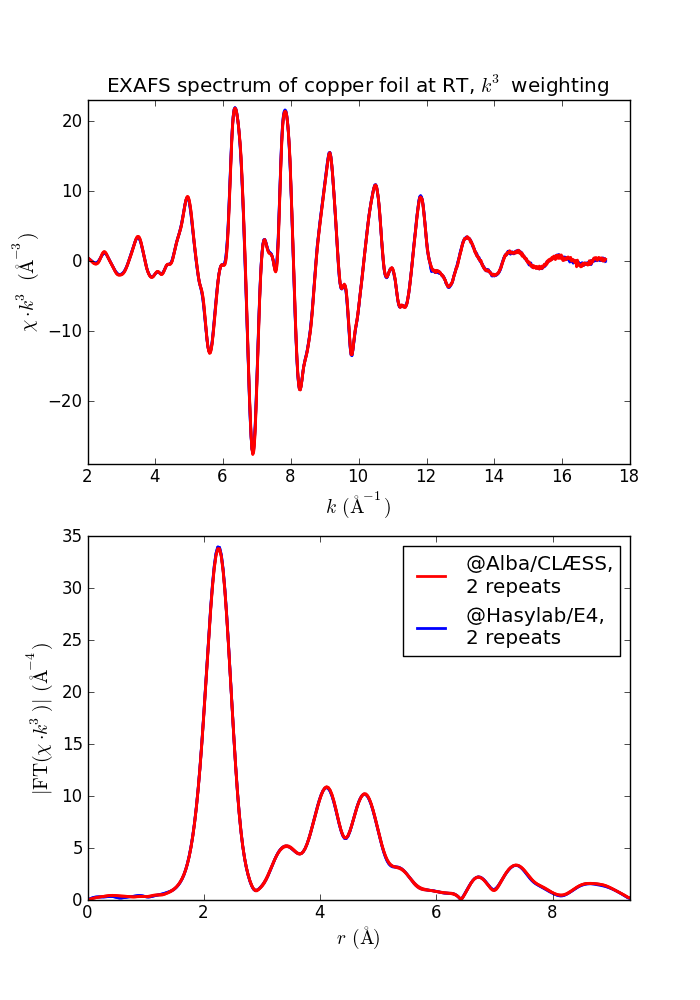
The figures below show two copper foil spectra in comparison with two ones taken at Hasylab. In both cases each spectrum took about 20 min. All 4 spectra practically fully merge (!) except in the XANES where our better energy resolution gives sharper features.

 mu

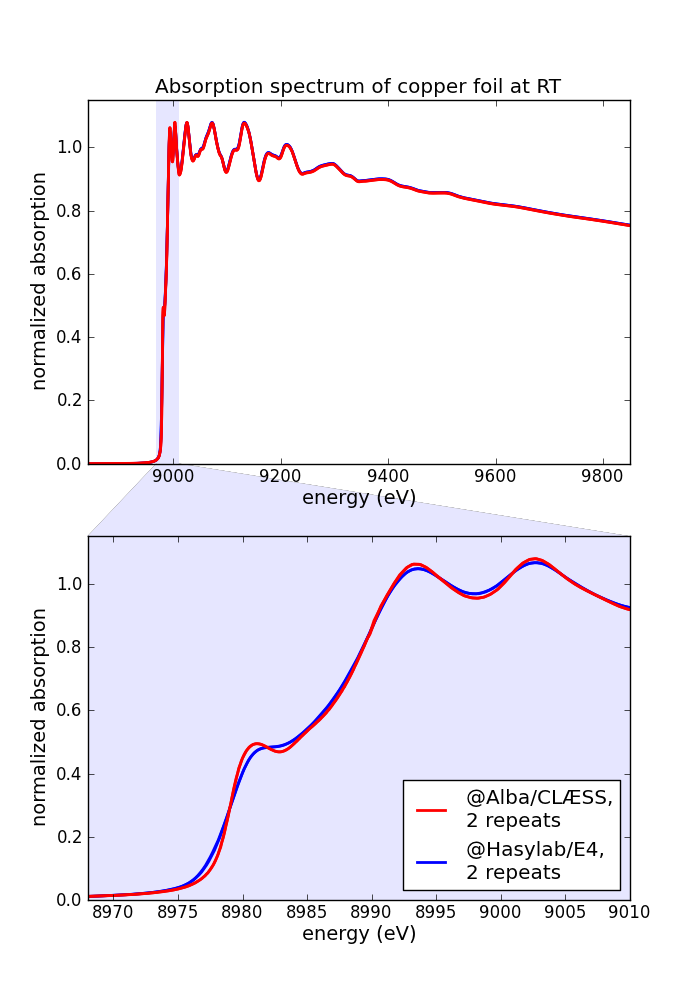
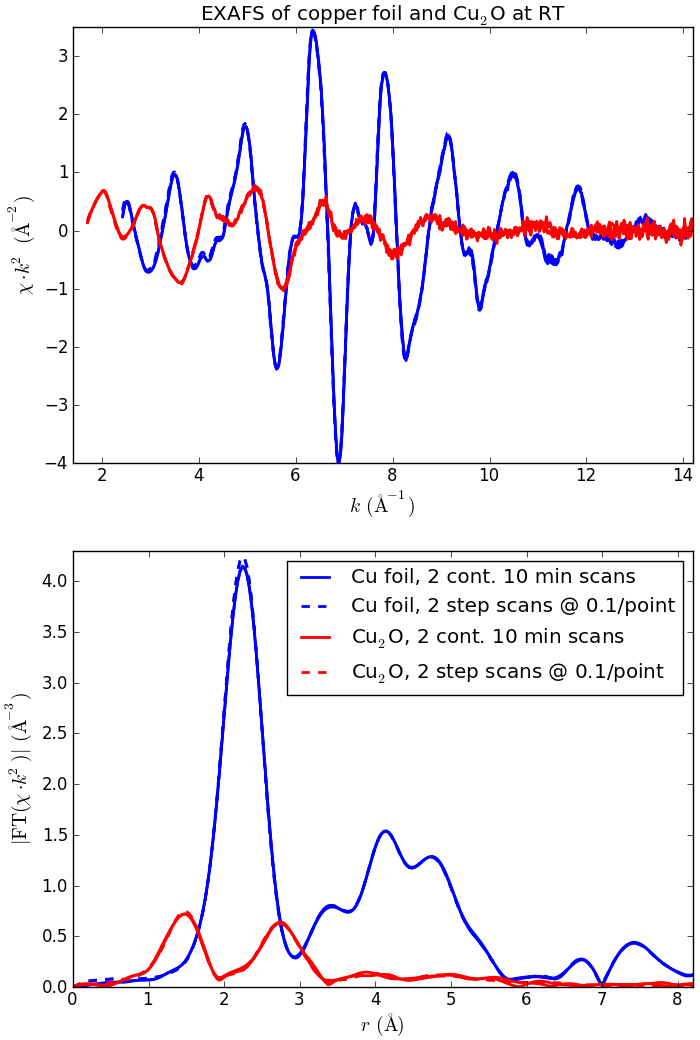
 EXAFS with different k-weighting:
EXAFS weighted by k^2 EXAFS weighted by k^3


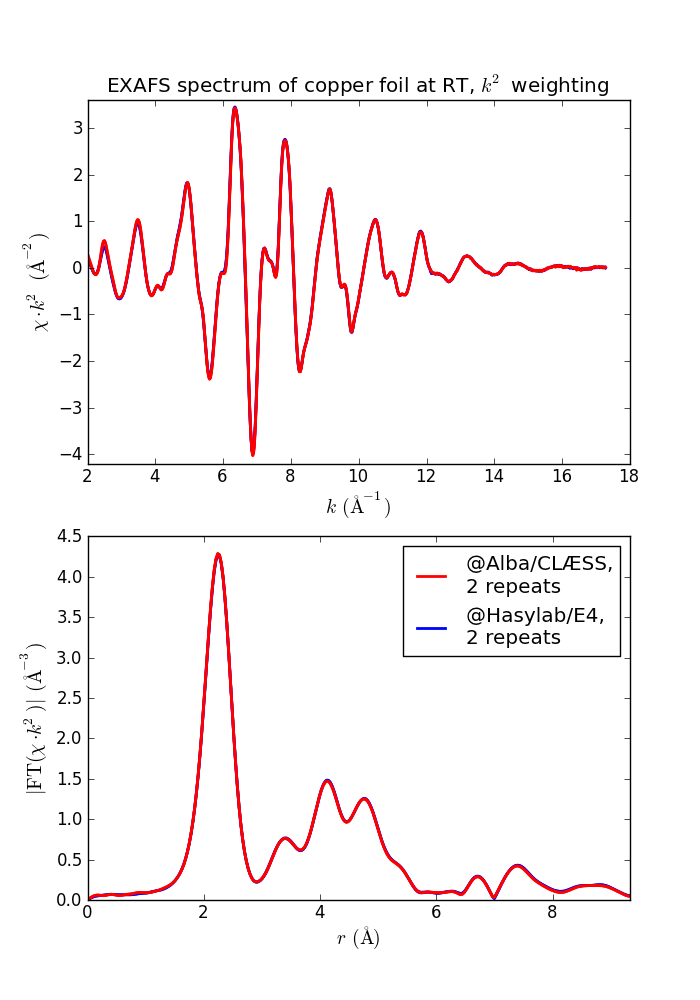
22.12.2011 The first absorption spectra measured at the sample position

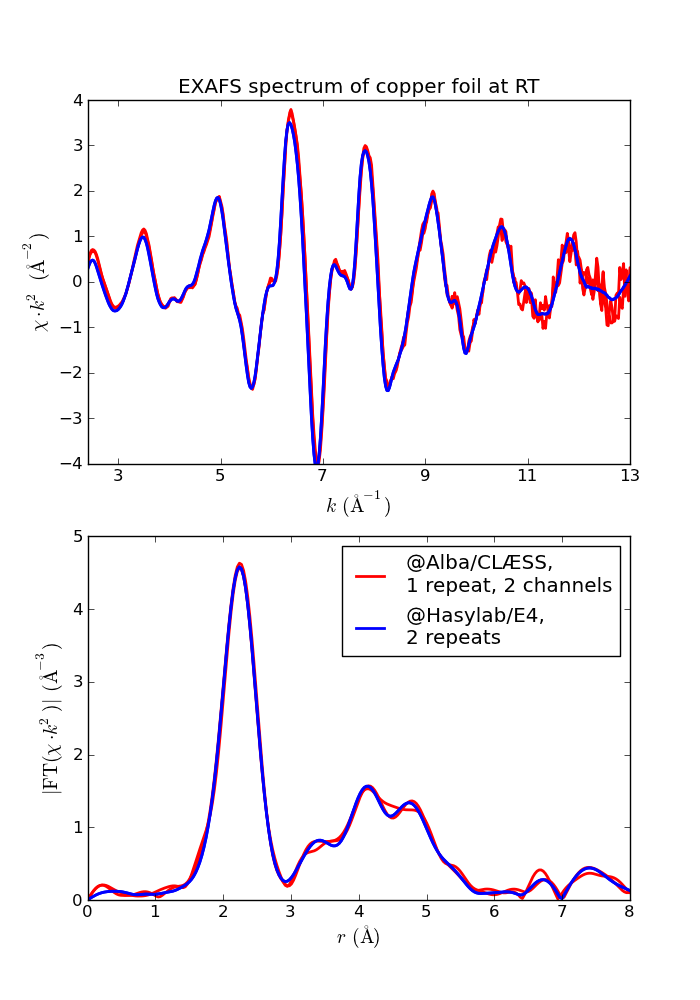
The figures below show the first spectra of copper foil measured in transmission mode using two ionization chambers. The chambers were open to atmosphere and therefore the signals were not optimal. If filled with Ar, the second chamber is expected to give ~30 times higher signal. The hardware gating system is not functional yet; the synchronization is done by software means. This is an additional source of noise at present. The XANES spectra are with constant dE steps of 0.5 eV and acquisition time 0.1 s per point. The EXAFS spectra are with constant dk steps of 0.025 Å-1 and acquisition time increasing as k2. The comparison is made with the spectra measured at Hasylab/E4 beamline in transmission mode. One can see a better energy resolution at CLÆSS (better resolved features at the absorption edge) due to the beam collimation in front of the monochromator.

XANES of Cu foil measured in EH EXAFS of Cu foil measured in EH

Yet better energy resolution can be obtained with the Si 311 crystal pair, at the expense of photon flux:

XANES of Cu foil measured in EH

The EXAFS spectra measured with the Si311 crystals are noisier, have several uncompensated glitches and therefore are not demonstrated here. This operation mode will be improved by fine adjustment of the beamline optics and by the ongoing development of the timing system.

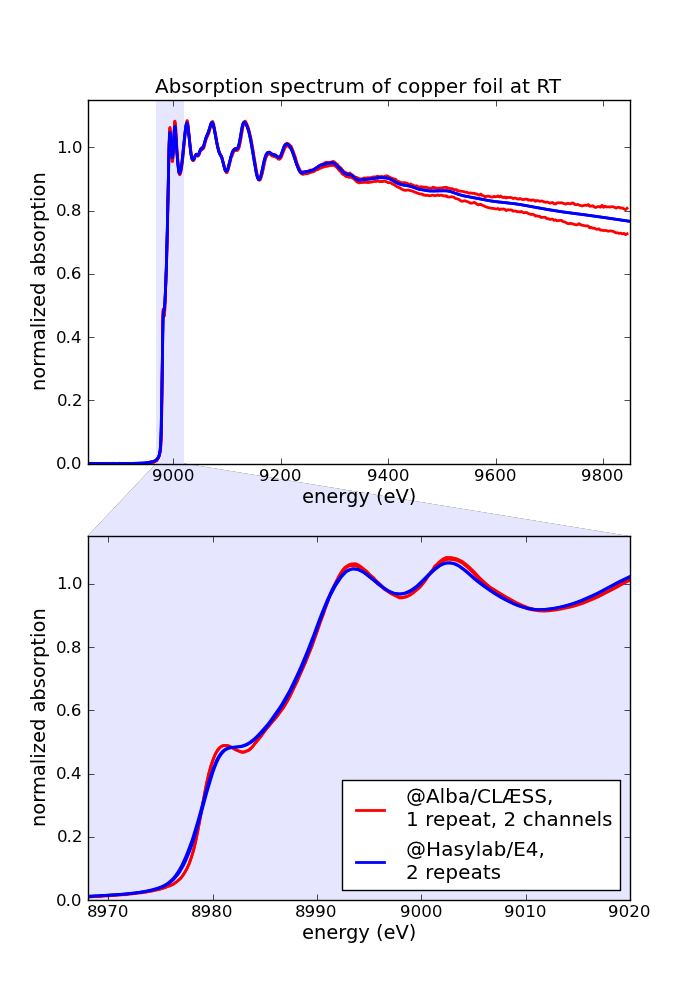
28.10.2011 The first absorption spectra measured in optical hutch

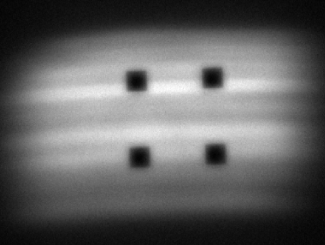
The figures below show the first spectra of copper foil at the Cu K-edge measured in fluorescence mode by the 4-diode beam position monitor (BPM). The XANES spectra are with constant dE steps of 0.5 eV and acquisition time 0.25 s per point. The EXAFS spectra are with constant dk steps of 0.025 Å-1 and acquisition time proportional to k2 (0.1 to 0.7 s per point, ~12 min in total). The comparison is made with the spectra measured at Hasylab/E4 beamline in transmission mode. The washed-out absorption features are due to the self absorption effect which cannot be corrected here because the fluorescence is not normalized to the incident intensity (the BPM itself is an I0 monitor and there is none other upstream of it). The increasing trend is due to decreasing absorption in the used 1-mm-thick carbon filter.

XANES of Cu foil measured in OH EXAFS of Cu foil measured in OH

Document Actions