VIPER (Visual Processing in EXAFS Researches)
|

| observe also my program for XANES and a program calculating absorption mass, thickness, step height etc. |
![]()
| The 32-bit version is finally out. Now it can be natively run under 64-bit Windows. Many thanks to Roman Chernikov (Hasylab-DESY) for making it available! |
- Author: Konstantin Klementiev
- Abstract:
- Several glitch- and step-corrections on absorptance curve with simultaneous observation of the EXAFS curve. Before this, glitches are detected on the derivative level of the first ionization chamber current.
- Energy calibration with optional constant-E or constant-theta shift.
- Deconvolution of absorption coefficient with monochromator resolution curve and/or core-hole lifetime deconvolution.
- The extraction of EXAFS-part, χ(k). Three methods for the construction of the atomic-like absorption are realized: (i) by a spline drawn through the knots varied to minimize the low-r EXAFS FT part; (ii) by a smoothing spline and (iii) by a Bayesian smoothing curve. The last two can take into account a priori information about the atomic-like absorption (edge shape, multi-electron contribution, etc.). χ(k) extraction can be verified simultaneously by Fourier-transform. χ(k) or χ(E) can be corrected by user-defined functions f(k) or f(E) to correct, for example, the fluorescence self-absorption. The function f(E) may refer to the theoretical tables of absorption coefficients incorporated into the program. The self-absorption correcting formula can be easily generated by specifying the chemical composition. Errors of χ(k) are calculated by various ways in order to validate the spectrum extension.
- Fast Fourier analysis, k-weighting, several windowing functions. Phase and amplitude corrections. Decomposition into amplitude and phase and subsequent calculation of the EXAFS amplitude and phase.
- Fitting procedures for the first few coordination shells:
- By ordinary EXAFS formula. A user-defined (cumulant) extension is possible by specifying an additional phase and an additional exponent with any number of varied parameters. Multiple-edge refinement is possible.
- Using the radial distribution function RDF(r) specified by a user-defined formula, parameters of which then are varied. Multiple-edge refinement is possible.
- Using the oscillatory potential U(r) of the absorber-scatterer pair. The potential U(r) is set by a user-defined formula, parameters of which then are varied. U(r) may consist of many wells. Both classical and quantum approaches can be used.
All fit parameters can be fixed and constrained or related to the homogeneous parameters of the other shells (wells) by user-defined functions. Fitting is done either in k- or in r-space. Scattering amplitudes and phases must be calculated by other programs (FEFF format is recognized) or can be extracted by VIPER from a reference spectrum. The parameters and results of fitting can be saved in (and then a model can be loaded from) a database. Advanced error analysis is developed and applied. Statistical χ2- and F- tests can be performed at user request.
- Screenshots:
'Formats...' dialog box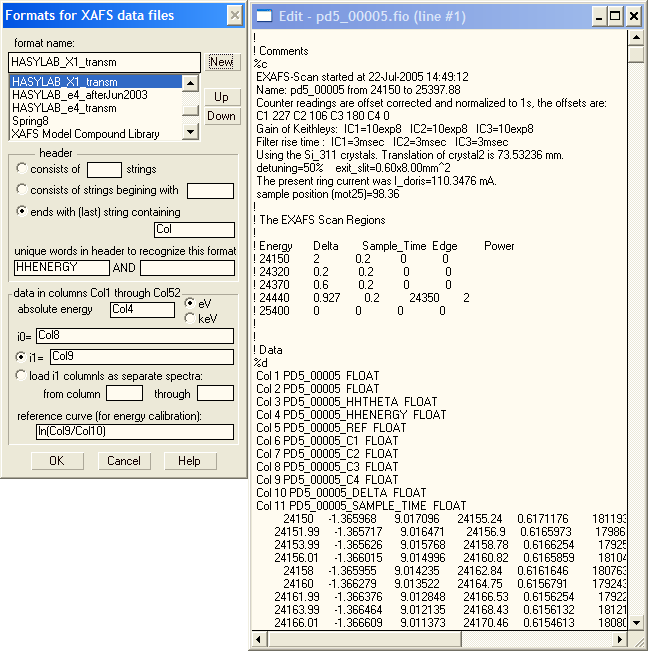
after opening an experimental file (containing currents of ionization chambers)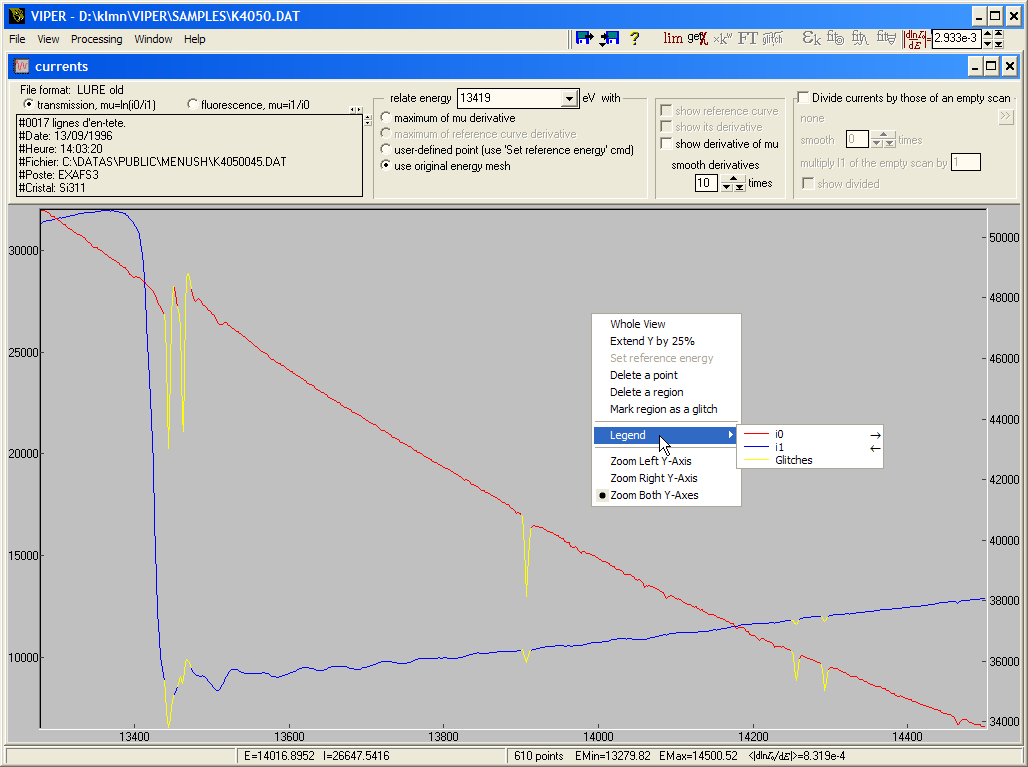
after pressing 'get χ' button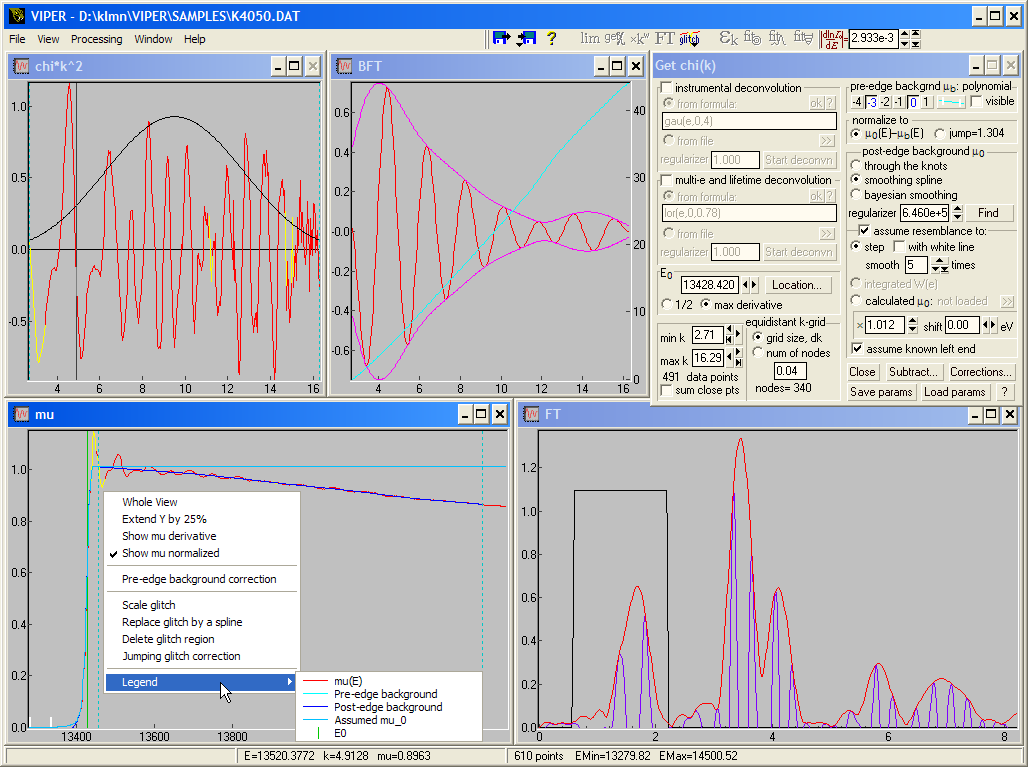
a filtered χ(k) is loaded and the command 'fitting using U(r)' is performed
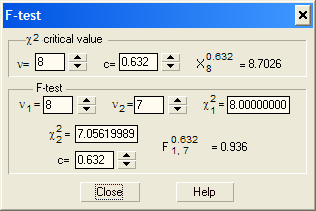
'Statistics' dialog box (after pressing 'Statistics...' button) with mapping and statistical tests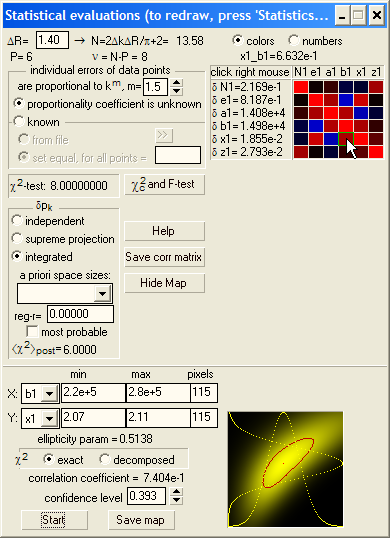
you can open as many files as you want (this is a series of CuZn-based catalysts under reduction treatment)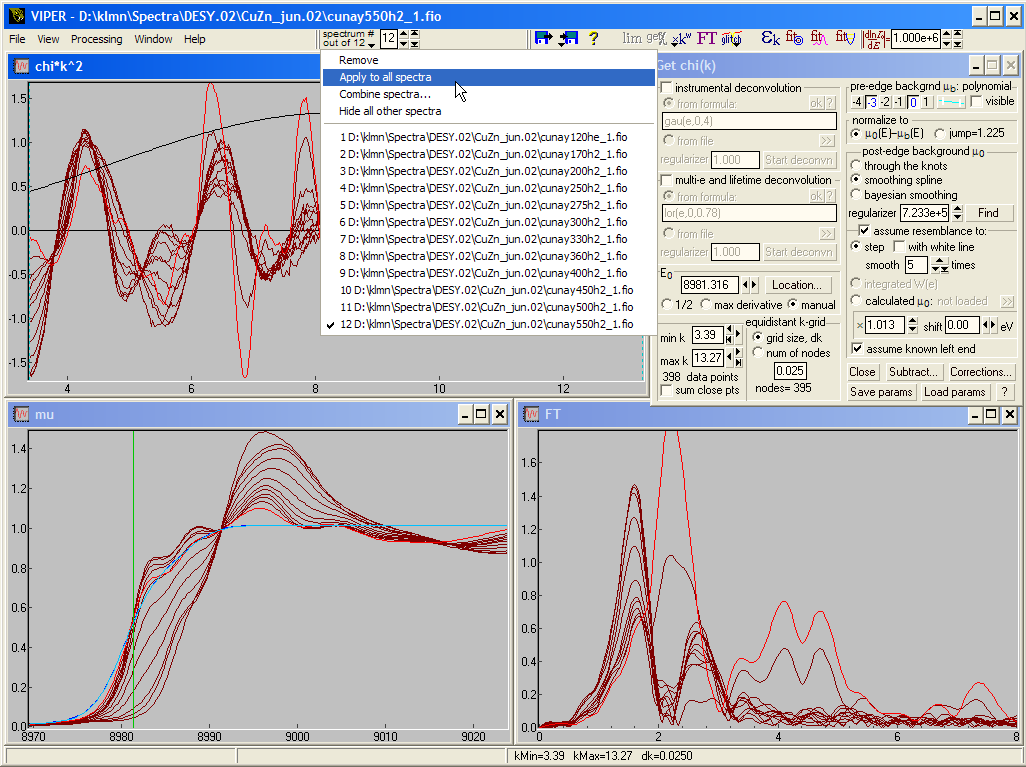
you can easily combine several spectra. Here are 6 fluorescence spectra ...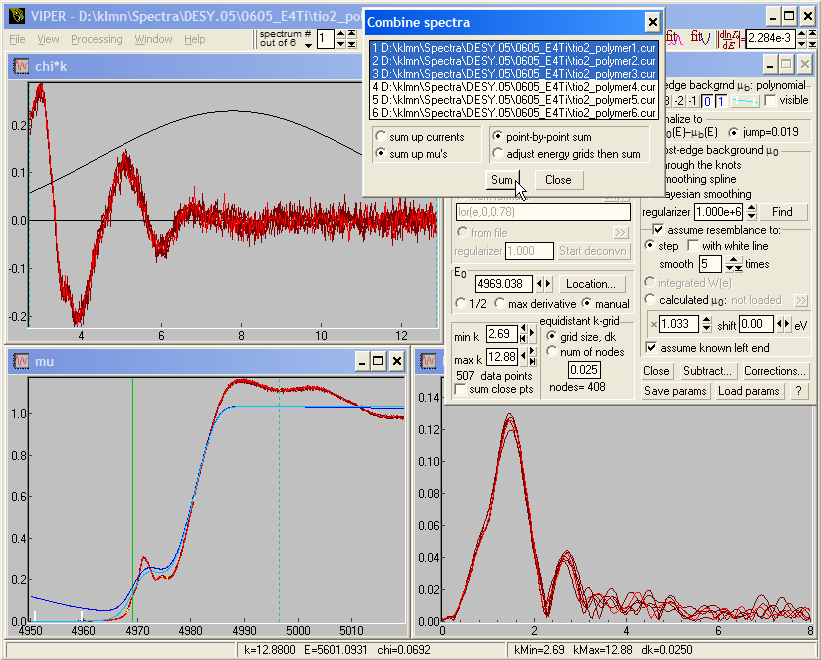
... combined into 2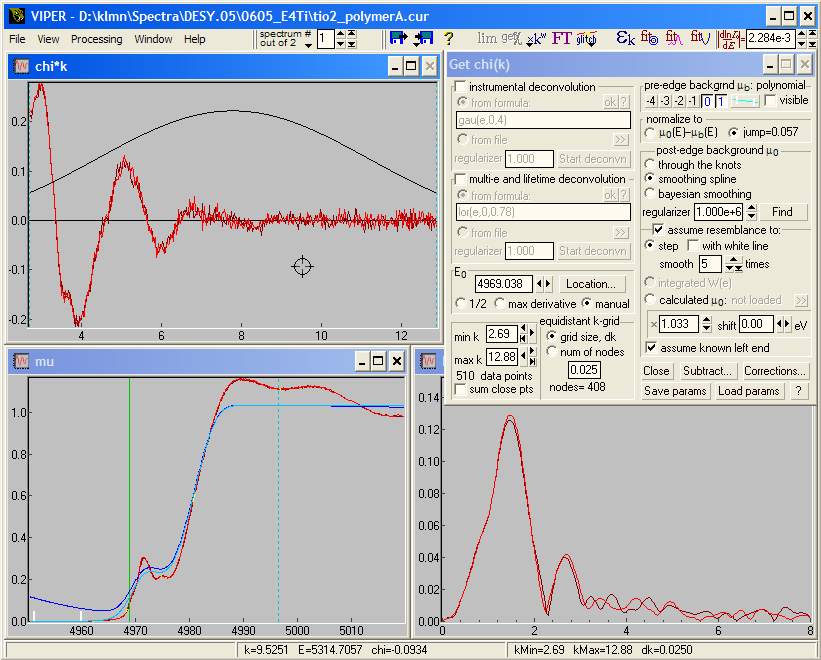
- Price: Free. You are only requested to send me bug reports.
- Documentation: pdf-file (2169k).
- Examples: provided in a separate zip-file (see the download page) as VIPER Project files (*.vpj). These files can be associated with VIPER (then you can double-click on them to open), or can be opened from the VIPER 'Load data' dialog. Open them all one by one and read the instructions.
- Hardware/Software Issues: Windows NT/2000/XP, 95/98/ME
- Input Data Format: ASCII text files. User should specify the file header and how to interpret and use the columns of data (or functions of these columns). Once described, the data formats are then recognized automatically.
- Citation: You are requested to cite VIPER as: "K. V. Klementiev, VIPER, freeware; K.V.Klementev, J. Phys. D: Appl. Phys. 34, 209-17 (2001)" [There is no typo in the names! Put it as written. Both versions refer to the same me :) The latter is an older version of the Cyrillic-to-Latin transcription of my surname. I can give you six more versions if you want :)]
A project file can be stored (and then opened) with all the individual parameters of chi extraction for every spectrum. All the curves (μ, χ, FT, BFT) can be stored by one shot, which is important if tens of data files are loaded.
| observe also my program for XANES and a program calculating absorption mass, thickness, step height etc. |
